In addition to the 1.6 million people incarcerated in federal and state prisons, there are 646,000 people locked up in more than 3,000 local jails throughout the U.S. Seventy percent of these people in local jails are being held pretrial — meaning they have not yet been convicted of a crime and are legally presumed innocent.
One reason that the unconvicted population in the U.S. is so large is because our country largely has a system of money bail, in which the constitutional principle of innocent until proven guilty only really applies to the well off. With money bail, a defendant is required to pay a certain amount of money as a pledged guarantee he will attend future court hearings. If he is unable to come up with the money either personally or through a commercial bail bondsman, he can be incarcerated from his arrest until his case is resolved or dismissed in court.
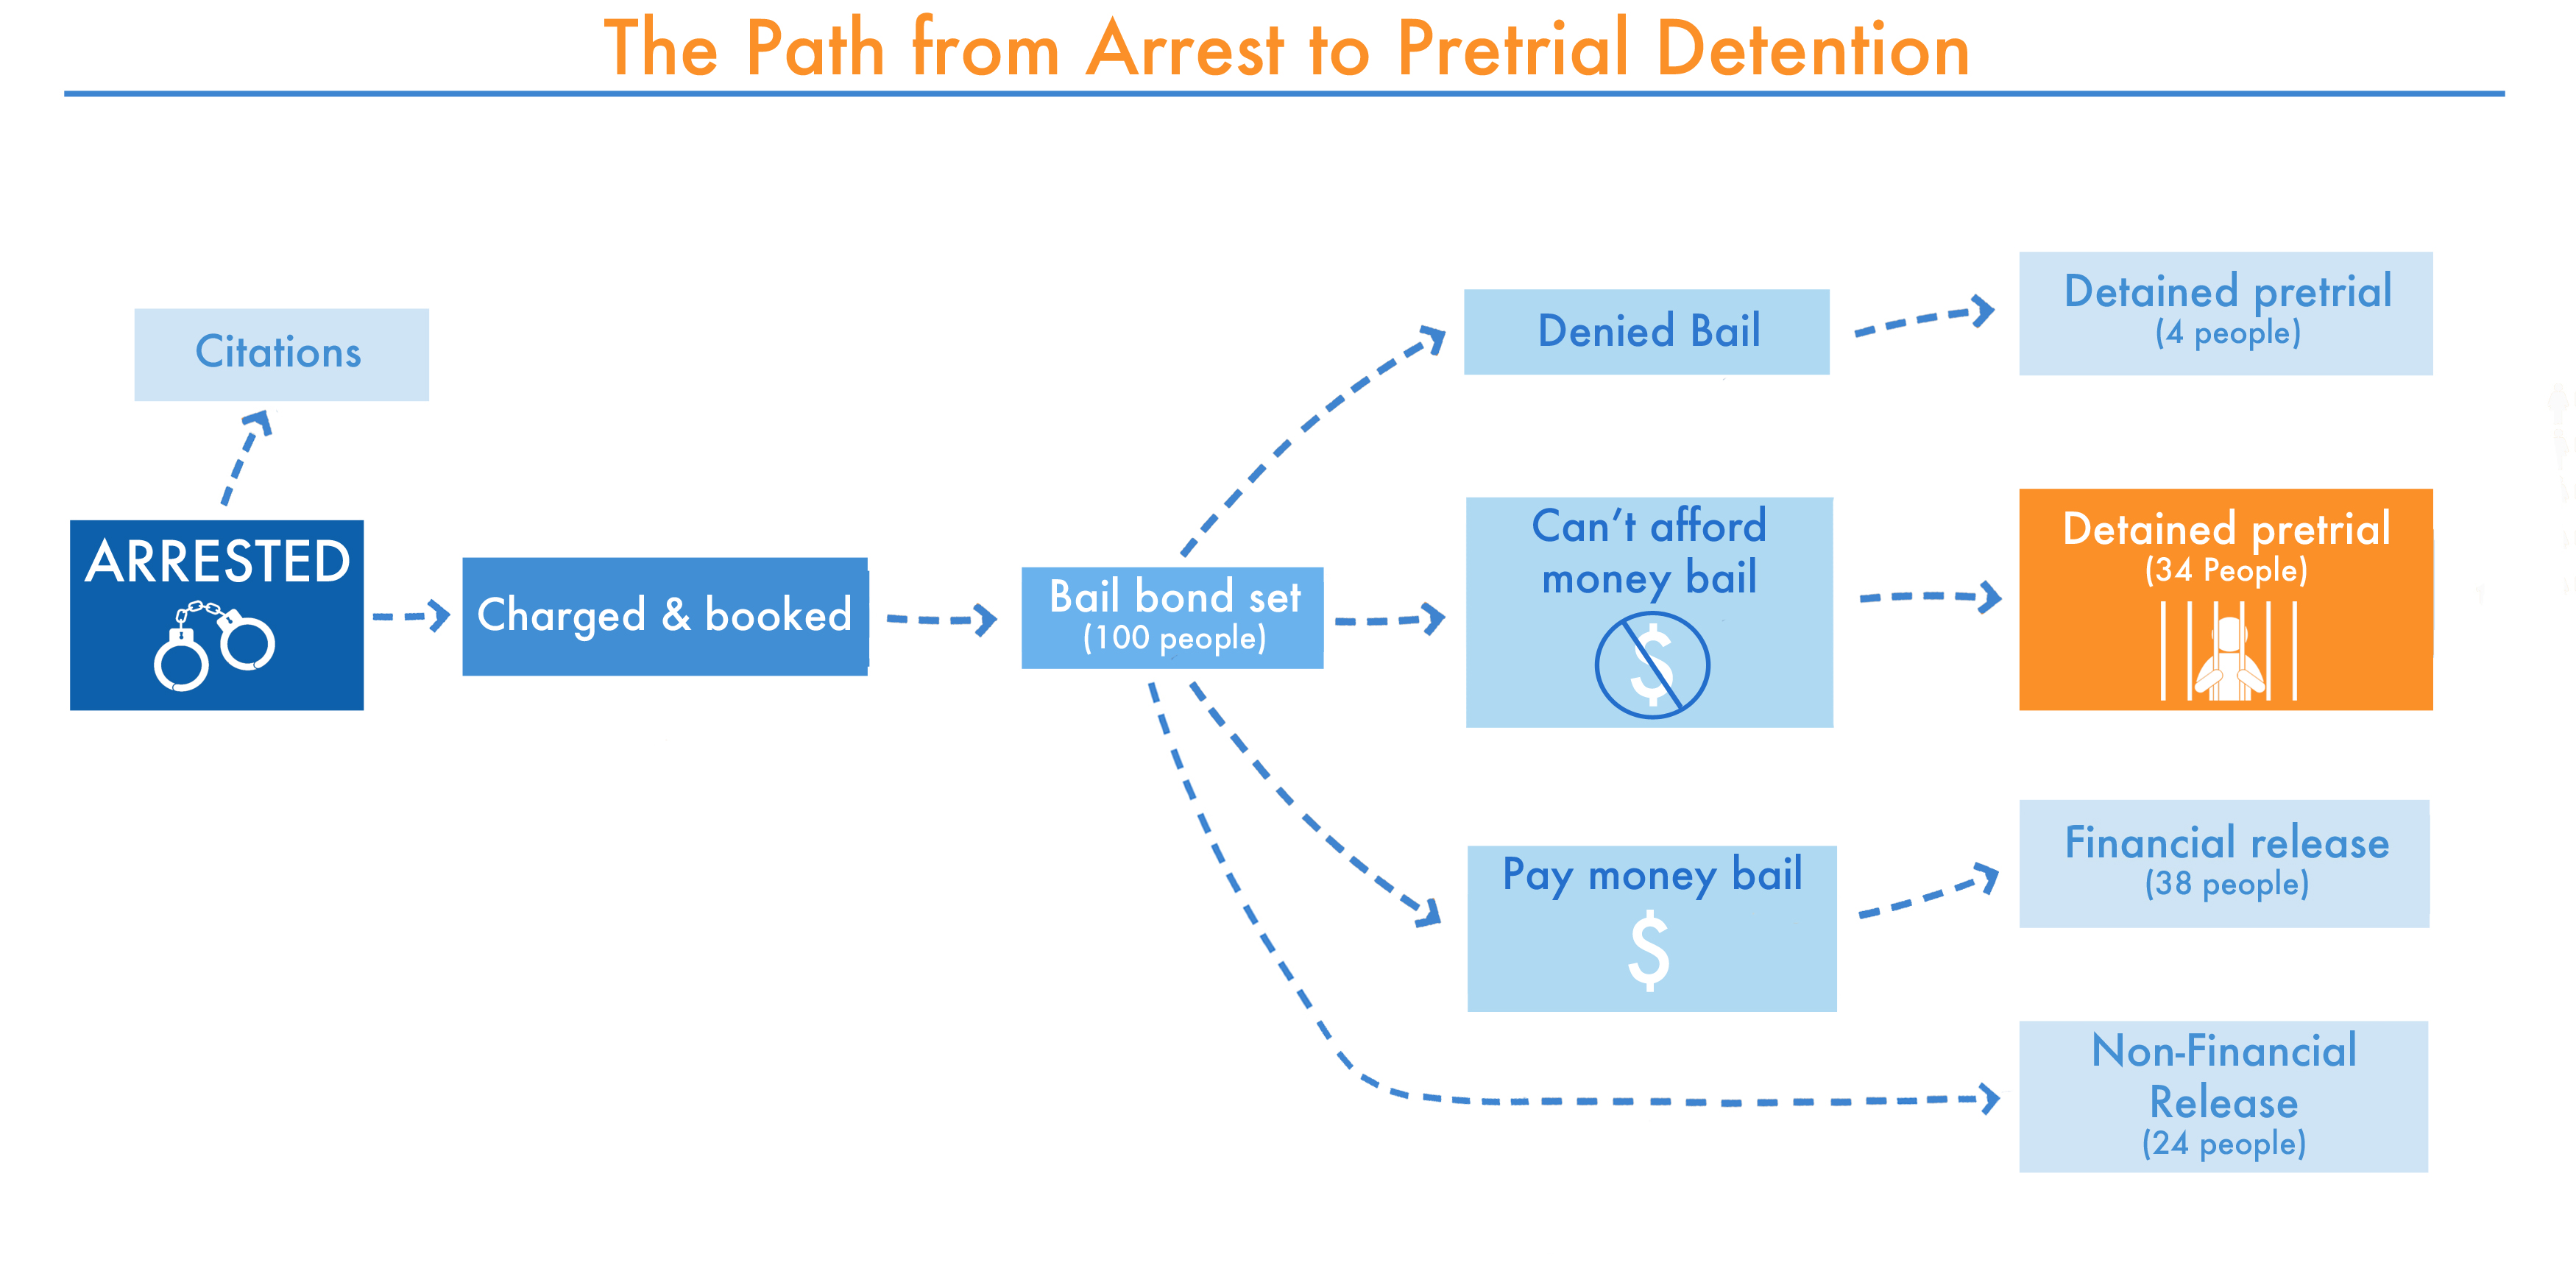 Figure 1. Since the 1980s, there has been a significant, nationwide move away from courts allowing non-financial forms of pretrial release (such as release on own recognizance) to money bail, although this does vary substantially depending on jurisdiction. This chart illustrates the possible paths from arrest to pretrial detention. Almost all defendants will have the opportunity to be released pretrial if they meet certain conditions, and only a very small number of defendants will be denied a bail bond, mainly because a court finds that individual to be dangerous or a flight risk. The only national data on pretrial detention that we are aware of comes from the Bureau of Justice Statistics’ Felony Defendants in Large Urban Counties series. Nationally, in 2009, 34% of defendants were detained pretrial for the inability to post money bail. This report focuses on this important population: those who are detained pretrial because they could not afford money bail.
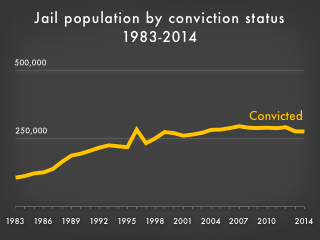
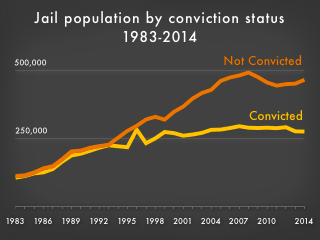
While the jail population in the U.S. has grown substantially since the 1980s, the number of convicted people in jails has been flat for the last 15 years. Detention of the legally innocent has been consistently driving jail growth, and the criminal justice reform discussion must include a discussion of local jails and the need for pretrial detention reform. This report will focus on one driver of pretrial detention: the inability to pay what is typically $10,000 in money bail. Building off our July 2015 report on the pre-incarceration incomes of people in prison, this report provides the pre-incarceration incomes of people in local jails who were unable to post a bail bond. This report aims to give the public and policymakers the foundation for a more informed discussion about whether requiring thousands of dollars in bail bonds makes sense given the widespread poverty of the people held in the criminal justice system and the high fiscal and social costs of incarceration.
People in jail are even poorer than people in prison and are drastically poorer than their non-incarcerated counterparts.
We find that most people who are unable to meet bail fall within the poorest third of society. Using Bureau of Justice Statistics data, we find that, in 2015 dollars, people in jail had a median annual income of $15,109 prior to their incarceration, which is less than half (48%) of the median for non-incarcerated people of similar ages. People in jail are even poorer than people in prison and are drastically poorer than their non-incarcerated counterparts.
| People in jail unable to meet bail (prior to incarceration) |
Non-incarcerated people | ||||
|---|---|---|---|---|---|
| Men | Women | Men | Women | ||
| All | $15,598 | $11,071 | $39,600 | $22,704 | |
| Black | $11,275 | $9,083 | $31,284 | $23,760 | |
| Hispanic | $17,449 | $12,178 | $27,720 | $14,520 | |
| White | $18,283 | $12,954 | $43,560 | $26,136 | |
Figure 2. Median annual pre-incarceration incomes for people in local jails unable to post a bail bond, ages 23-39, in 2015 dollars, by race/ethnicity and gender. The incomes in red fall below the Census Bureau poverty threshold. The median bail bond amount nationally is almost a full year’s income for the typical person unable to post a bail bond.
| Men | Women | |
|---|---|---|
| All | 61% | 51% |
| Black | 64% | 62% |
| Hispanic | 37% | 16% |
| White | 58% | 50% |
Figure 3. Percentage difference between the median pre-incarceration annual incomes for people in local jails unable to post a bail bond and non-incarcerated people, ages 23-39, in 2015 dollars, by race/ethnicity and gender.
Unsurprisingly, white men have the highest incomes before incarceration while Black women have the lowest incomes before incarceration. The difference for Black men is particularly dramatic. Black men in jail have a pre-incarceration median income 64% lower than that of their non-incarcerated counterparts.
Examining the median pre-incarceration incomes of people in jail makes it clear that the system of money bail is set up so that it fails: the ability to pay a bail bond is impossible for too many of the people expected to pay it. In fact, the typical Black man, Black woman, and Hispanic woman detained for failure to pay a bail bond were living below the poverty line before incarceration. The income data reveals just how unrealistic it is to expect defendants to be able to quickly patch together $10,000, or a portion thereof, for a bail bond. The median bail bond amount in this country represents eight months of income for the typical detained defendant.
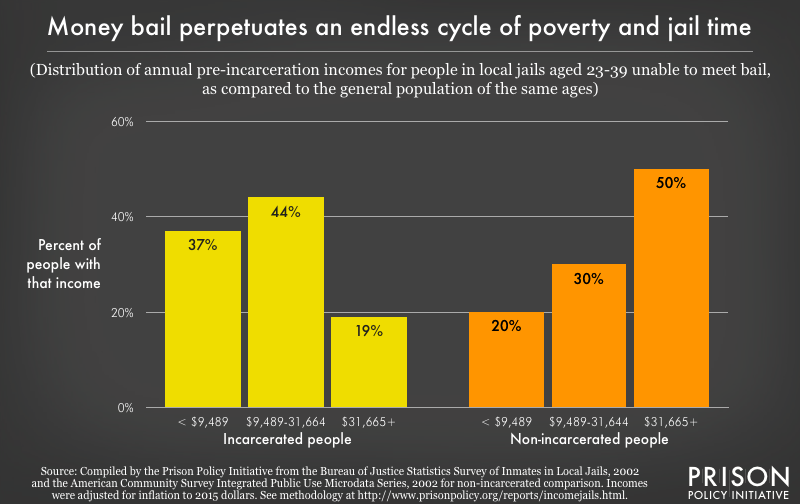 Figure 4. People in local jails unable to meet bail are concentrated at the lowest ends of the national income distribution, especially in comparison to non-incarcerated people. As this graph shows, 37% had no chance of being able to afford the typical amount of money bail ($10,000) since their annual income is less than the median bail amount.
The median bail bond amount in this country represents eight months of income for the typical detained defendant.
Because a system of money bail allows income to be the determining factor in whether someone can be released pretrial, our nation’s local jails are incarcerating too many people who are likely to show up for their court date and unlikely to be arrested for new criminal activity. Although, on paper, it is illegal to detain people for their poverty, such detention is the reality in too many of our local jails. Our country now has a two-track system of justice in which the cost of pretrial liberty is far higher for poor people than for the well off.
Recommendations
This report shines light on another injustice of the American criminal justice system — the unnecessary and excessive detention of poor people in our local jails. To truly make our local communities safer and ensure that bail decisions are based on more than how much money one has, states, local governments, and sheriffs should:
- Eliminate the use of money bail
Too many jails are detaining people not because they are dangerous, but because they are too poor to afford bail bonds. One study of felony defendants nationwide found that an additional 25% percent of defendants could be released pretrial without any increases to pretrial crime. The study found that many counties could safely release older defendants, defendants with clean records, and defendants charged with fraud and public order offenses, all without threatening public safety.At a time when the White House is condemning money bail as “a crude way to screen pretrial defendants for their risk of flight or to the community,” states and local governments should eliminate money bail. Instead, courts can increase their use of non-financial forms of pretrial release such as release on own recognizance, which is when a defendant signs an agreement that he will appear in court as required and is not required to pay any money for pretrial release. Another option is to use unsecured bonds instead of money bail. Through unsecured bonds, a defendant is not required to pay any money to be released pretrial, but he will be liable to pay an agreed upon amount of money if he does not appear for court. Unsecured bonds are as effective at achieving public safety and court appearance as money bail and much more effective at freeing up jail beds. States and local governments interested in eliminating money bail can follow the lead of Kentucky and the District of Columbia. Kentucky banned for-profit money bail 40 years ago, and a statewide agency instead uses a risk assessment tool to determine who will be released pretrial. In D.C., most defendants are released on own recognizance, during which time they are supervised by the D.C. Pretrial Services Agency. Both Kentucky and D.C. have remained successful at ensuring defendants show up for court and avoid arrest for new criminal activity. - Stop locking people up for failure to pay fines and fees
As the criminal justice system and its associated costs have grown, states and local governments such as Ferguson, Missouri have adopted a misguided policy: charging defendants fines and fees to pad their correctional, and even municipal, budgets. Because, as this report shows, the people who are being charged these fines and fees are largely poor, states and local governments unsurprisingly have difficulty collecting these funds and, for failing to pay criminal justice debt, people can land in jail. For example, in Rhode Island in 2007, 18% of defendants were locked up for criminal justice debt.States and local governments should stop locking people up for failure to pay criminal justice debt that they cannot afford, a practice repeatedly deemedunconstitutional by the U.S. Supreme Court. If states and local governments decide that charging fines and fees is worth the effort, they should consider ability to pay when assessing fines and fees and be flexible by allowing payment plans, community service in lieu of payment, and exemption waivers for poor defendants. For example, in 2011, Washington State passed legislation permitting waivers of interest that is accrued on criminal justice debt while a person is locked up. After researching the net gains of fee collections, Leon County, Florida decided to close its Collections Court and terminated thousands of outstanding arrest warrants. - Reduce the number of arrests that lead to jail bookings through increased use of citations and diversion programs
Despite falling crime rates, the likelihood of arrest has increased modestly for violent and property crimes and dramatically for drug crimes over the past three decades. More arrests hinder criminal justice reform by increasing the number of people locked up in the U.S. By choosing to lock up people who need mental health and substance use services and not jail time, American jails have become de facto mental health institutions.One of the best yet underused reforms available to our local criminal justice systems is for police to reduce the number of arrests that lead to jail bookings. Instead, police can cite people so that defendants can wait for their court date at home without having to post money bail or risk losing employment. Kentucky, Maryland, and D.C. have all increased their use of citations. States and local governments can also follow the lead of Seattle, which implemented Law Enforcement Assisted Diversion (LEAD). Through LEAD, police officers connect people — who are often battling chronic homelessness, substance use, and mental health challenges — to social services rather than bringing them to jail. LEAD has been effective at both reducing arrests and slowing the rate at which people arrested for low-level crimes cycle through Seattle jails. - Increase funding of indigent criminal defense
Most defendants are too poor to afford a private attorney to represent them. Further, while the Supreme Court has affirmed the constitutional right to counsel at initial appearance, in reality, only 10 states and D.C.provide counsel at initial appearance. A study of defendants in Baltimore found that the failure to provide legal representation when bail bonds are determined was a leading reason for lengthy pretrial detention. Defendants who were represented had a median jail stay of two days while unrepresented defendants had a much longer median jail stay of nine days.Greater funding of indigent criminal defense is imperative to making sure that incarceration is only used when necessary and that the sentence is proportional to the offense. Increased funding could ensure both that the right to counsel is the reality for even the poorest defendants and that more defendants have the guidance of an attorney earlier in the legal process, such as when the bail bond amount is set or reviewed. One recent example is in San Francisco, where the public defender’s office has assembled a Bail Unit. Comprised of two lawyers, two paralegals, and interns, the Bail Unit works to contest bail bonds for nearly all of the public defender’s clients. - Eliminate all pay-to-stay programs
Jails and prisons in forty-one states charge incarcerated people for room and board through pay-to-stay programs. For example, Riverside County, California requires incarcerated people to pay $142 per day for their incarceration. Now that the data in this report can confirm that the majority of people that fill our local jails are poor, states and local governments should resist the temptation to create new forms of criminal justice fees, such as increasingly common pay-to-stay programs. Otherwise, states and local governments risk spending more on the administrative costs of collection than the little money they are able to chase down. In 2013, Riverside County had collected less than 1% of what it hoped to generate through its pay-to-stay program.If states and local governments insist on having a pay-to-stay program, they should, at the very least, make sure to research the likelihood that a program would be worth it before implementation. For example, when a committee was formed in Massachusetts to consider whether introducing a room and board fee in prisons and jails would feasibly increase revenue, the committee concluded that the harms of additional fees outweighed the benefit. - Reduce the high costs of phone calls home from prisons and jails and stop replacing in-person jail visits with expensive video visitation
Phone calls home from prisons and jails and increasingly common remote video visits typically cost $1 per minute. The high prices of these communications products act like a regressive tax, charging the people who have the least the most to keep in touch. As a result, more than a third of families of incarcerated people fall into debt to cover phone and visitation costs. And it is these same family members who defendants often turn to when trying to scrape together money for bail bonds or other criminal justice fines and fees.While the Federal Communications Commission has been working to protect incarcerated people and their family members from these high costs, a federal court has stayed parts of the FCC’s last round of regulations. States and local governments should not wait around until the lawsuit is resolved. Instead, they should follow the lead of many states such as New York and, recently, Mississippi by immediately reducing the rates in their phone and video visitation contracts. States and local governments should also protect the in-person visitation rights of people in local jails and resist the temptation to replace free in-person visitation with expensive computer chats. Recognizing how video visitation is cost-prohibitive for many families, the state of Texas as well as Multnomah County, Oregon and Alameda County, California have all protected in-person visitation rights for people in local jails.
Methodology
Background
This is not the first report to address the incomes of incarcerated people. The Bureau of Justice Statistics (BJS) collects this data periodically (most recently in 2002 with another survey scheduled to begin in 2018) but does not routinely publish the results in a format that can be accessed without statistical software. The BJS last published a complete analysis of the survey results in 2004. Last year, we produced a report on the pre-incarceration incomes of people in state prison. This report focuses on the pre-incarceration incomes of people in local jails, and, even more specifically, on the incomes of people incarcerated in local jails who had the opportunity to post bail, but could not meet it. This report included both convicted (people who were detained for the entire pretrial period and then sentenced to jail time) and unconvicted people because only looking at the unconvicted population detained pretrial would have been too small of a sample size.
This report was not intended to make the point that incarceration causes poverty, although there is extensive research on that topic. Because the Prison Policy Initiative is regularly asked about the role that poverty plays in who ends up behind bars, this report is aimed at answering a different question: are incarcerated people poorer than non-incarcerated people? In particular, we often hear that 80% of defendants nationwide are indigent, but we wanted to be able to put numbers to the problem in the hopes of furthering the conversation on the growth of pretrial detention and the urgent need for bail reform.
To be clear, this report relies on the Bureau of Justice Statistics survey from 2002, which is both quite old and the newest available. While we look forward to the Bureau of Justice Statistics administering a survey in 2018, it will take a few years before that data is published, and we know of no reason or trend that would make relying on the 2002 survey less reliable than the alternatives of using data that is even older or no data at all.
Further research should look at the effects of educational attainment and prior prison or jail time on the pre-incarceration incomes and identify policies that could address those disparities.
Data sources and process
This report is the result of a collaboration between Bernadette Rabuy, Senior Policy Analyst at the Prison Policy Initiative, and data scientist Daniel Kopf, who joined our Young Professionals Network in February 2015.
Together, we studied the BJS Survey of Inmates in Local Jails, 2002 relying in particular on the questions listed below and then developing a way to make the data comparable to non-incarcerated people.
- S7Q11c. Which category on this card represents your personal monthly income from ALL sources for the month before your arrest?
- S1Q1a. Sex
- S1Q2a. What is your date of birth?
- S1Q3a. Are you of Spanish, Latino, or Hispanic origin?
- S1Q3c. Which of these categories describes your race?
- S3Q3a. At any time after your arrest for the…charge(s) was bail or bond set?
- S3Q3c. Were you released on bail or bond?
The non-incarcerated data comes from the Census Bureau’s American Community Survey (ACS), specifically from the Integrated Public Use Microdata Series (IPUMS). We used data from 2002 both because this was the same year as the incarcerated survey data, and because the ACS in 2002 included only people in households and did not include jails and other group quarters.
Because income is correlated with age and because the incarcerated population trends younger than the general U.S. population, we thought it would be most accurate to compare people of similar ages. We limited our study to the 25th and 75th percentiles of ages for incarcerated people (ages 23–39), and we used the same age range for the non-incarcerated population.
To make all of this data more accessible and useful, we converted all data in two ways: We converted monthly incomes to annual incomes by multiplying by 12, and we multiplied each income by 1.32 to adjust for inflation from 2002 to 2015, as provided by the Bureau of Labor Statistics CPI Inflation Calculator. (We chose to adjust to 2015 dollars instead of 2016 because the 2016 index value will change from month to month. Because 2016 is not yet over, the 2016 index value is based only on the latest monthly values.)
In addition, to provide an estimated median income for each incarcerated race/ethnicity/gender group from the BJS “grouped frequency” data, we followed these steps:
- Take the distance between the smallest and largest number in the group containing the median
- Multiply this number by the following: ( ( (total data points/2) – total data points in groups with lower numbers) / data points in group containing median )
- Add lowest number in group containing the median
On definitions
Note that throughout this report, the incomes for incarcerated people are the incomes incarcerated people reported earning before their arrest, not the incomes they earned through work programs behind bars. For incarcerated people and non-incarcerated people, incomes include welfare and other public assistance. For incarcerated people, incomes also include illegal sources of income.
We use “Non-incarcerated” to refer to people in households, and thereby exclude people in group quarters, including people in correctional facilities, psychiatric hospitals, college/university housing, or residential treatment facilities.
Our data on “Blacks” and “Whites,” relies on data for Non-Hispanic Blacks and Non-Hispanic Whites. The federal government defines Black and White as races while Hispanic is defined as an ethnicity (and, therefore, it is possible to identify as both Hispanic and White or Hispanic and Black). Our data for both incarcerated people and non-incarcerated people allowed us to avoid overlap by separately talking about Non-Hispanic Whites, Non-Hispanic Blacks, and Hispanics.
Appendix
The 2002 BJS survey asked incarcerated people what their personal monthly income was the month before their arrest. First, the data in this appendix is presented in monthly incomes and has not been adjusted for inflation. Second, the data in this appendix is presented for people in local jails in general. In this report, we focus on the people in local jails who had the opportunity to be released pretrial but were unable to meet the conditions of bail.
The following tables and graphs allow for comparisons between the incomes of incarcerated people prior to incarceration and the incomes of non-incarcerated people for each of the income categories that BJS provides respondents in its Survey of Inmates in Local Jails. The graphs also show that incarcerated people are dramatically concentrated at the lower ends of the national income distribution.
| People in jails (prior to incarceration) |
Non-incarcerated people | ||||
|---|---|---|---|---|---|
| Men | Women | Men | Women | ||
| All | $1,061 | $671 | $2,500 | $1,433 | |
| Black | $900 | $568 | $1,975 | $1,500 | |
| Hispanic | $1,114 | $709 | $1,750 | $917 | |
| White | $1,236 | $813 | $2,750 | $1,650 | |
Figure 5. Median monthly pre-incarceration incomes for people in local jails, in 2002 dollars, ages 23-39, by race/ethnicity and gender.
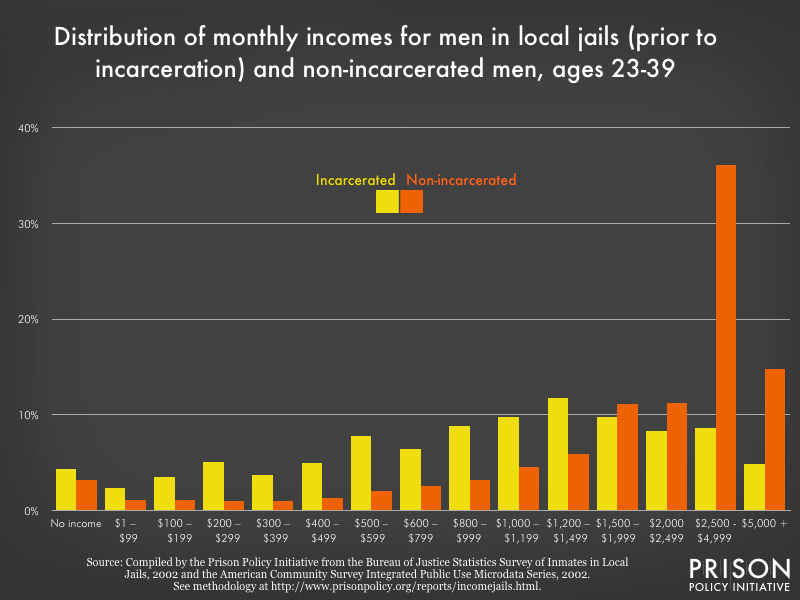 Figure 6. Distribution of monthly pre-incarceration incomes for men in local jails and non-incarcerated men, 2002 dollars, ages 23-39
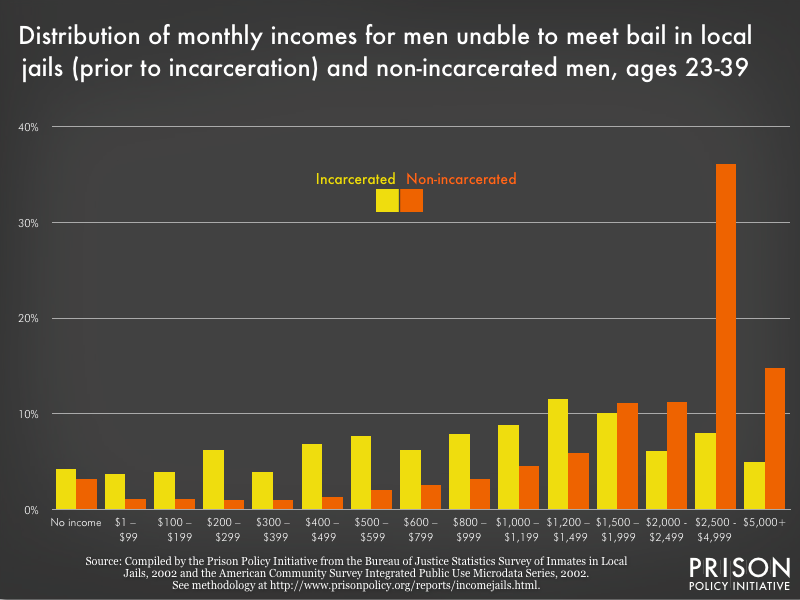 Figure 7. Distribution of monthly pre-incarceration incomes for men unable to meet bail and non-incarcerated men, 2002 dollars, ages 23-39
| Income category | Proportion of men in local jails with that income (prior to incarceration) |
Proportion of men unable to meet bail with that income (prior to incarceration) |
Proportion of non-incarcerated men with that income |
|---|---|---|---|
| $0 | 4.37% | 4.21% | 3.22% |
| $1-99 | 2.35% | 3.71% | 1.13% |
| $100-199 | 3.48% | 3.92% | 1.06% |
| $200-299 | 5.04% | 6.17% | 0.95% |
| $300-399 | 3.75% | 3.9% | 0.96% |
| $400-499 | 4.99% | 6.82% | 1.26% |
| $500-599 | 7.79% | 7.71% | 2.02% |
| $600-799 | 6.44% | 6.22% | 2.60% |
| $800-999 | 8.81% | 7.9% | 3.22% |
| $1,000-1,199 | 9.78% | 8.75% | 4.45% |
| $1,200-1,499 | 11.70% | 11.47% | 5.88% |
| $1,500-1,999 | 9.72% | 10.08% | 11.08% |
| $2,000-2,499 | 8.30% | 6.13% | 11.18% |
| $2,500-4,999 | 8.66% | 7.99% | 36.15% |
| $5,000+ | 4.82% | 5.01% | 14.84% |
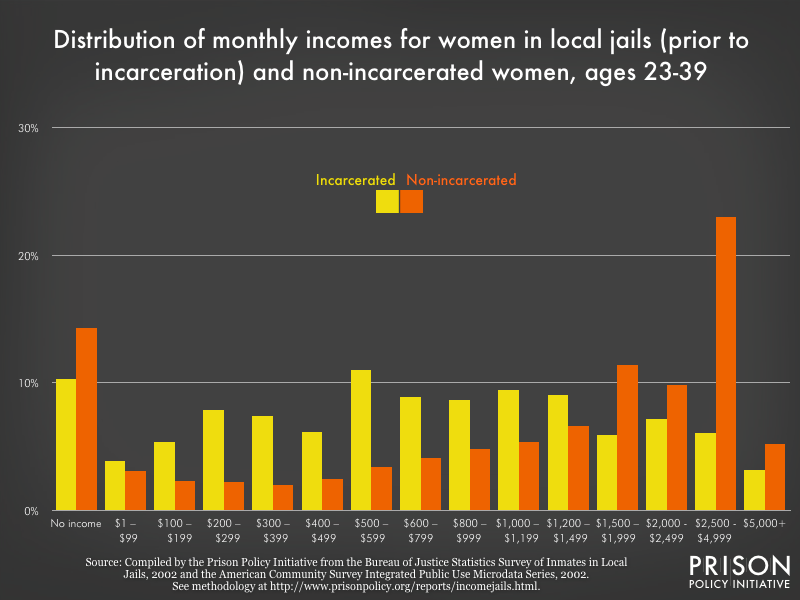 Figure 9. Distribution of monthly pre-incarceration incomes for women in local jails and non-incarcerated women, 2002 dollars, ages 23-39. While most people in local jails make less prior to incarceration than people on the outside, there is one interesting anomaly in the data for women not present in the data for men. More non-incarcerated women report no income at all than incarcerated women prior to incarceration. For both groups, the reported incomes include wages, welfare, and other public assistance, but since these are individual surveys, they do not include spousal income. It is likely that many of those non-incarcerated women with zero reported income are receiving support from their spouses.
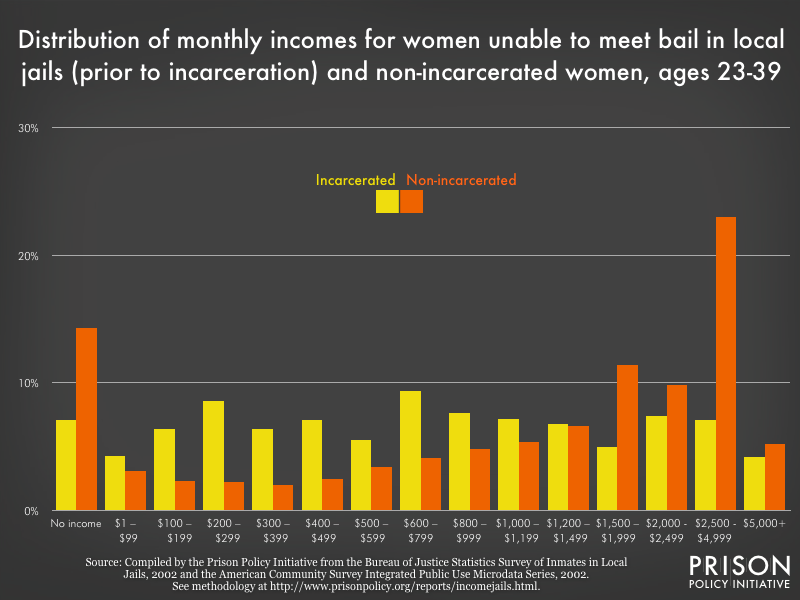 Figure 10. Distribution of monthly pre-incarceration incomes for women unable to meet bail and non-incarcerated women, 2002 dollars, ages 23-39
| Income category | Proportion of women in local jails with that income (prior to incarceration) |
Proportion of women unable to meet bail with that income (prior to incarceration) |
Proportion of non-incarcerated women with that income |
|---|---|---|---|
| $0 | 10.27% | 7.13% | 14.3% |
| $1-99 | 3.85% | 4.29% | 3.1% |
| $100-199 | 5.40% | 6.38% | 2.3% |
| $200-299 | 7.89% | 8.57% | 2.2% |
| $300-399 | 7.39% | 6.37% | 2.0% |
| $400-499 | 6.16% | 7.12% | 2.5% |
| $500-599 | 10.98% | 5.45% | 3.4% |
| $600-799 | 8.91% | 9.45% | 4.1% |
| $800-999 | 8.67% | 7.65% | 4.8% |
| $1,000-1,199 | 9.40% | 7.15% | 5.4% |
| $1,200-1,499 | 9.02% | 6.81% | 6.6% |
| $1,500-1,999 | 5.89% | 4.99% | 11.4% |
| $2,000-2,499 | 7.14% | 7.35% | 9.8% |
| $2,500-4,999 | 6.09% | 7.13% | 23% |
| $5,000+ | 3.21% | 4.17% | 5.2% |
Acknowledgments
This report was made possible thanks to the generous contributions of individuals across the country who support justice reform. Figure 1 and the jail population by convicted status animated graph were made possible by Elydah Joyce and Jacob Mitchell of the organization’s Young Professionals Network, respectively. Bob Machuga created the covers, and the rest of the Prison Policy Initiative staff helped the authors gather research. The authors would like to thank the Pretrial Justice Institute both for providing invaluable feedback on an early draft of the report and the great work they do for pretrial justice. Any errors or omissions, however, are the sole responsibility of the authors.
About the authors
Bernadette Rabuy is the Senior Policy Analyst at the Prison Policy Initiative. Bernadette produced the first comprehensive national report on the video visitation industry, Screening Out Family Time: The for-profit video visitation industry in prisons and jails, finding that 74% of local jails that adopt video visitation eliminate traditional in-person visits. Her research has played a key role in protecting in-person family visits in jails in Portland, Oregon and the state of Texas. In her other work with the Prison Policy Initiative, Bernadette has worked to empower the criminal justice reform movement with key but missing data through the annual Mass Incarceration: The Whole Pie reports as well as last year’s report, Prisons of Poverty, which for the first time provided the pre-incarceration incomes of women in state prison. Bernadette is on Twitter at @BRabuy
Daniel Kopf is a data scientist in California and writer at Priceonomics who has been a member of our Young Professionals Network since February 2015. He has previously written about bail and has co-authored several exciting statistical reports with the Prison Policy Initiative: Prisons of Poverty: Uncovering the pre-incarceration incomes of the imprisoned, Separation by Bars and Miles: Visitation in state prisons, and The Racial Geography of Mass Incarceration. He has a Masters in Economics from the London School of Economics. Dan is on Twitter at @dkopf